Flagship products where clinical needs, AI, and user workflows converge. 임상 요구, AI, 사용자 워크플로가 하나로 수렴하는 프로덕션 제품들.
Canopus SW · Patented MSI diagnostic system with clinical deployment Canopus SW · 특허 MSI 진단 시스템 — 임상 배포 완료
My role담당 역할
Project Lead & AI Engineer: Owned the complete product lifecycle — clinical requirement gathering (pathologist interviews), system architecture design, AI model development (>0.99 AUC), C#–Python integration, IEC 62304-aligned software engineering practices, and production deployment. 프로젝트 리드 & AI 엔지니어: 병리학자 인터뷰를 통한 임상 요구사항 수집, 시스템 아키텍처 설계, AI 모델 개발(>0.99 AUC), C#–Python 통합, IEC 62304 정렬 소프트웨어 엔지니어링 실무 적용, 프로덕션 배포까지 전체 제품 주기를 책임졌습니다.
Problem문제
Conventional MSI testing relies on NGS or Genescan: results take 10–14 days, costs are high, and interpretation depends on scarce expert analysts. MSI detection from digital-PCR melting data was unreliable in research and absent in production. Clinical labs need a certified system that combines data analysis + AI scoring + operator review + PDF export while meeting strict regulatory and security standards. 기존 MSI 검사는 NGS·Genescan에 의존합니다 — 결과 회신까지 10–14일, 높은 비용, 숙련 분석 인력 부족이라는 한계가 있습니다. 디지털 PCR 멜팅 데이터의 MSI 검출은 연구에서 신뢰성이 낮고 프로덕션에는 부재했습니다. 임상실험실은 데이터 분석 + AI 스코어링 + 운영자 검토 + PDF 내보내기를 결합하면서 엄격한 규제·보안 기준을 충족하는 인증 시스템이 필요합니다.
Solution해결책
Canopus is a digital-melting-based AI determination software that analyzes the GenSpectra™ MSI Kit (real-time digital PCR + high-resolution melting). It ingests BAT26 / CAT25 melting data, generates Tm histograms, and an ML classifier predicts an MSI Score that auto-classifies each sample as MSI-H / Borderline / MSS — returning a result in ~85 minutes with no expert review required. Built as a 3-layer architecture: C# UI (workflows) · C# signal processing (PCR/melting) · Python AI (patented Tm extraction + MSI scoring), with medical-grade security: encryption, access control, audit trails, compliance docs. Canopus는 GenSpectra™ MSI Kit(real-time 디지털 PCR + 고해상도 멜팅, HRM)를 분석하는 디지털 멜팅 기반 AI 판정 소프트웨어입니다. BAT26 / CAT25 멜팅 데이터를 입력받아 Tm 히스토그램을 생성하고, ML 분류기가 MSI Score를 예측해 각 검체를 MSI-H / Borderline / MSS로 자동 분류합니다 — 전문가 판독 없이 약 85분 만에 결과를 제공합니다. 3계층 구조로 구축: C# UI(워크플로) · C# 신호 처리(PCR/멜팅) · Python AI(특허 Tm 추출 + MSI 스코어링). 의료 등급 보안: 암호화, 접근 제어, 감사 추적, 준수 문서.
C# UI LayerC# UI 레이어
Sample management · MSI score visualization · Threshold interpretation · Operator review workflow · PDF export with audit trails.샘플 관리 · MSI 점수 시각화 · 임계값 해석 · 운영자 검토 · 감사 추적 PDF 내보내기.
C# Analysis EngineC# 분석 엔진
Digital PCR + melting curve analysis · Preprocessing · Tm distribution modeling · QA checks · AI-ready data structures.PCR + 멜팅 커브 분석 · 전처리 · Tm 분포 모델링 · QA 확인 · AI 준비 데이터.
Python AI ModulePython AI 모듈
Patented Tm feature extraction · ML-based MSI-H scoring · Confidence metrics · Model validation.특허 Tm 특성 추출 · ML 기반 MSI-H 스코어링 · 신뢰도 지표 · 모델 검증.
How the AI determines MSIAI가 MSI를 판정하는 방식
Trained on a labeled FFPE cohort (MSS · Borderline · MSI-H), the classifier learns the Tm-histogram patterns that distinguish microsatellite-stable from MSI-high samples. At inference, each new sample's BAT26 / CAT25 melting distribution is converted into a Tm histogram, the model outputs an MSI Score (%), and thresholds auto-classify the result: MSI-H ≥ 35% · Borderline 25–35% · MSS < 25%. A "data flywheel" lets the model be retrained as testing data accumulates, steadily improving accuracy across versions. 라벨링된 FFPE 코호트(MSS · Borderline · MSI-H)로 학습한 분류기는 현미부수체 안정(MSS)과 MSI-high 검체를 구분하는 Tm 히스토그램 패턴을 학습합니다. 추론 단계에서 새 검체의 BAT26 / CAT25 멜팅 분포를 Tm 히스토그램으로 변환하면 모델이 MSI Score(%)를 산출하고, 임계값이 결과를 자동 분류합니다: MSI-H ≥ 35% · Borderline 25–35% · MSS < 25%. "데이터 선순환(Data Flywheel)" 구조로 검사 데이터가 쌓일수록 모델을 재학습해 버전을 거치며 정확도를 지속 개선합니다.
Competitive positioning경쟁 포지셔닝
vs. NGS (FoundationOne CDx)vs. NGS (FoundationOne CDx)
NGS: 95+ loci, 10–14 days, high cost. Canopus + GenSpectra: 2 markers, ~85 min, no matched-normal needed.NGS: 95+ loci, 10–14일, 고비용. Canopus + GenSpectra: 2개 마커, 약 85분, 정상 대조 검체 불필요.
vs. CE (Promega OncoMate)vs. CE (Promega OncoMate)
Capillary electrophoresis: 4–6 h, manual peak-shift review, internal control required. Canopus: AI score-based, no internal control.모세관 전기영동: 4–6시간, 수기 피크 시프트 판독, 내부 대조 필요. Canopus: AI 스코어 기반, 내부 대조 불필요.
Performance성능
~98% sensitivity (MSI-H) · ~97% specificity · FFPE tissue used directly, no matched normal.~98% 민감도(MSI-H) · ~97% 특이도 · FFPE 조직 직접 사용, 정상 대조 불필요.
Impact & Achievement성과 & 달성
- Patented core algorithms특허 핵심 알고리즘 — 2–10× signal resolution improvement over existing methods기존 방법 대비 2–10× 신호 해상도 향상
- ROC-AUC up to 0.9998 — MSI-Classifier validated across a clinical dataset of 862 FFPE samples spanning 19 cancer types (colorectal, gastric, endometrial, and more)19개 암종(대장·위·자궁내막 등)에 걸친 862개 임상 FFPE 검체 데이터셋에서 MSI-Classifier 검증
- Solved the clinical-data bottleneck임상 데이터 병목 해결 — built Tm Histogram Generator to synthesize validated virtual training data and pre-train the model, overcoming the shortage of labeled FFPE samples that limits deep-learning diagnosticsTm Histogram Generator를 개발해 검증된 가상 학습 데이터를 합성하고 모델을 사전학습, 딥러닝 진단의 발목을 잡는 라벨 FFPE 검체 부족 한계를 극복
- ~98% / ~97% — sensitivity (MSI-H) and specificity (MSS), surpassing manual expert review; results in ~85 min vs. 10–14 days for NGS민감도(MSI-H)·특이도(MSS) 달성으로 수기 판독 대비 우수 — NGS의 10–14일 대비 약 85분 내 결과 제공
- Clinical deployment readiness임상 배포 준비도 — production-focused quality controls with encrypted data, audit trails, and security documentation; IEC 62304-aligned release (V.1.3) with IFU암호화 데이터, 감사 추적, 보안 문서화를 포함한 프로덕션 중심 품질 관리 — IFU를 갖춘 IEC 62304 정렬 릴리스(V.1.3)
- Currently deployed in pathology labs병리학 실험실 현재 배포 운용 중 — clinicians report improved workflow efficiency and result confidence임상의들이 워크플로 효율성과 결과 신뢰도 향상을 보고
Key decisions & tradeoffs핵심 의사결정 및 트레이드오프
- Why C# + Python integration instead of a pure Python stack:순수 Python 스택 대신 C# + Python 통합을 선택한 이유: C# provides superior real-time UI responsiveness and platform stability required for clinical workflows; Python offers superior ML model development agility and scientific computing ecosystem. The hybrid approach leverages each language's strengths while maintaining a clean IPC boundary, enabling independent scaling of the UI and AI tiers.C#는 임상 워크플로에 필요한 우수한 실시간 UI 반응성과 플랫폼 안정성을 제공하고, Python은 뛰어난 ML 모델 개발 민첩성과 과학 컴퓨팅 생태계를 제공합니다. 하이브리드 접근은 각 언어의 강점을 활용하면서 깔끔한 IPC 경계를 유지하여 UI와 AI 계층의 독립적 확장을 가능하게 합니다.
- Tradeoff between model accuracy and inference speed in the production environment:프로덕션 환경에서 모델 정확도와 추론 속도 사이의 트레이드오프: Prioritized accuracy (>0.99 AUC) over raw inference speed because MSI misclassification directly impacts clinical decisions. However, inference is constrained to <2 seconds per result via model quantization and batch processing optimization, balancing real-world laboratory throughput requirements with diagnostic confidence.MSI 오분류가 임상 결정에 직접 영향을 미치므로 순수 추론 속도보다 정확도(>0.99 AUC)를 우선시했습니다. 그러나 모델 양자화 및 배치 처리 최적화를 통해 추론을 결과당 <2초로 제한하여 실제 실험실 처리량 요구사항과 진단 신뢰도의 균형을 맞췄습니다.
- Regulatory constraints that influenced the architecture (IEC 62304 compliance):아키텍처에 영향을 준 규제 제약 (IEC 62304 준수): IEC 62304 mandates documented software lifecycle, traceability, and design controls. This drove the decision to implement strict module boundaries, version-controlled model checkpoints, and comprehensive audit logging. The architecture separates data handling (regulated C# tier) from research algorithms (Python tier), enabling efficient compliance documentation and change management.IEC 62304는 문서화된 소프트웨어 생명주기, 추적성, 설계 관리를 요구합니다. 이는 엄격한 모듈 경계, 버전 관리되는 모델 체크포인트, 종합적인 감사 로깅 구현 결정을 주도했습니다. 아키텍처는 데이터 처리(규제된 C# 계층)와 연구 알고리즘(Python 계층)을 분리하여 효율적인 컴플라이언스 문서화 및 변경 관리를 가능하게 합니다.
Engineering excellence엔지니어링 특징
Clinical requirements shaped architecture; patented innovations enabled superior AI performance; seamless C#–Python integration proved robust in production; comprehensive regulatory documentation supports lab adoption and compliance audit. 임상 요구사항이 아키텍처를 결정했고, 특허 혁신이 우월한 AI 성능을 가능하게 했으며, 원활한 C#–Python 통합이 프로덕션에서 견고성을 증명했고, 포괄적인 규제 문서화가 실험실 도입과 컴플라이언스 감사를 지원합니다.
Product direction제품 방향성
Canopus is OPTOLANE's first AI analysis platform — MSI is the entry point, and the validated architecture extends to further diagnostic targets. Canopus는 OPTOLANE의 첫 AI 분석 플랫폼입니다 — MSI를 시작점으로, 검증된 구조를 추가 진단 항목으로 확장합니다.
Now (V.1.x)현재 (V.1.x)
MSI module launch & stabilization · confirmatory clinical trial support · integrated dashboard + one-click PDF report.MSI 모듈 출시·안정화 · 확증 임상시험 대응 · 통합 대시보드 + 원클릭 PDF 리포트.
Next다음 단계
Multi-product selection · MLH1 and additional analysis targets · user-configurable decision thresholds.다중 제품 선택 기능 · MLH1 등 분석 항목 확장 · 사용자 설정 판정 임계값.
Mid–long term중장기
Built-in AI retraining · advanced reporting + multilingual support · multi-target analysis platform.AI 재학습 기능 내장 · 리포트 고도화 + 다국어 지원 · 다중 타깃 분석 플랫폼화.
AI classification pipeline — Tm Histogram → neural network → MSI Score → MSI-H / Borderline / MSSAI 분류 파이프라인 — Tm 히스토그램 → 신경망 → MSI Score → MSI-H / Borderline / MSS

MSI score prediction model — FFPE training pipeline (n=862, 19 cancer types)MSI 점수 예측 모델 — FFPE 학습 파이프라인 (n=862, 19개 암종)

MSI classifier performance — ROC-AUC = 0.9998 across the clinical cohortMSI 분류기 성능 — 임상 코호트 전체 ROC-AUC = 0.9998

Overcoming limited clinical data — synthetic Tm-histogram pre-training임상 데이터 부족의 극복 — 합성 Tm 히스토그램 사전학습(pre-training)
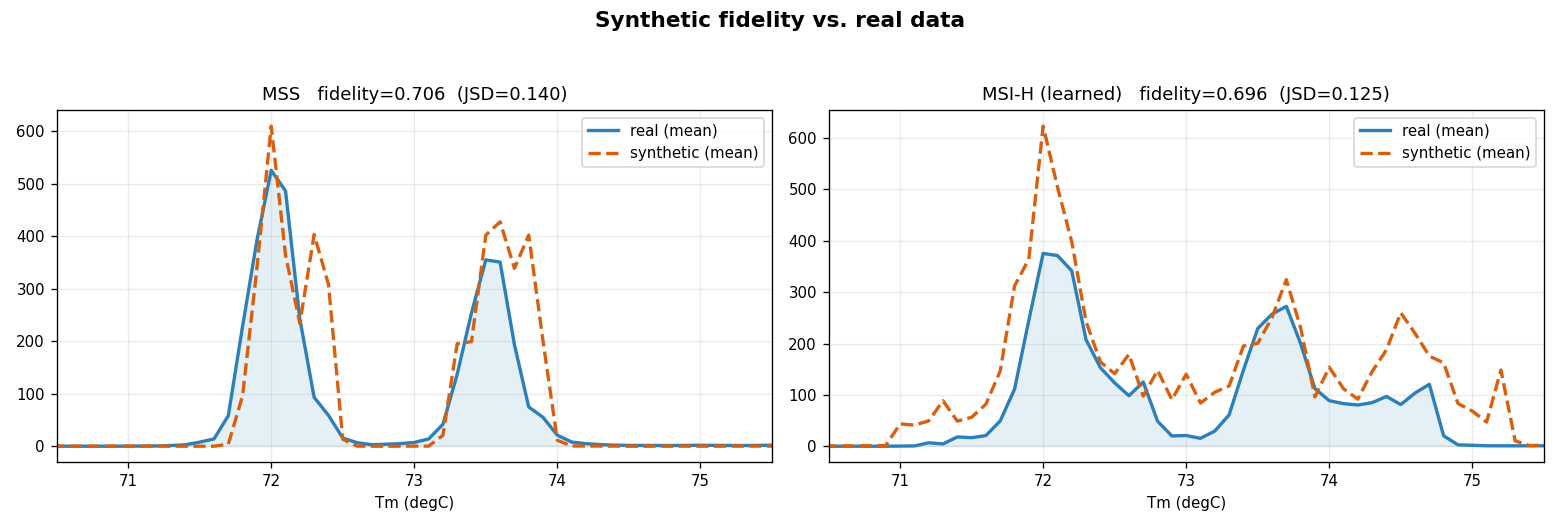
The hardest constraint in building the MSI classifier was the scarcity of labeled clinical FFPE samples — too few, and too imbalanced across cancer types, to train a robust deep model on their own. To break through this ceiling I built Tm Histogram Generator, a tool that synthesizes realistic virtual Tm histograms statistically matched to real clinical distributions (validated with Jensen–Shannon divergence). The classifier is pre-trained on this large synthetic corpus and then fine-tuned on the limited real data — turning a data shortage into a solved problem and measurably improving robustness and generalization across the 19-cancer-type cohort. MSI 분류기 개발에서 가장 큰 제약은 라벨링된 임상 FFPE 검체의 부족이었습니다 — 견고한 딥러닝 모델을 학습하기에는 절대량이 적고 암종별 분포도 불균형했습니다. 이 한계를 돌파하기 위해 Tm Histogram Generator를 직접 개발했습니다. 실제 임상 분포와 통계적으로 일치(Jensen–Shannon divergence로 검증)하는 가상 Tm 히스토그램을 대량으로 합성하는 도구입니다. 이 대규모 합성 데이터로 분류기를 사전학습(pre-training)한 뒤 제한된 실제 데이터로 미세조정하여, 데이터 부족이라는 한계를 해결하고 19개 암종 코호트 전반에서 견고성과 일반화 성능을 실질적으로 향상시켰습니다.
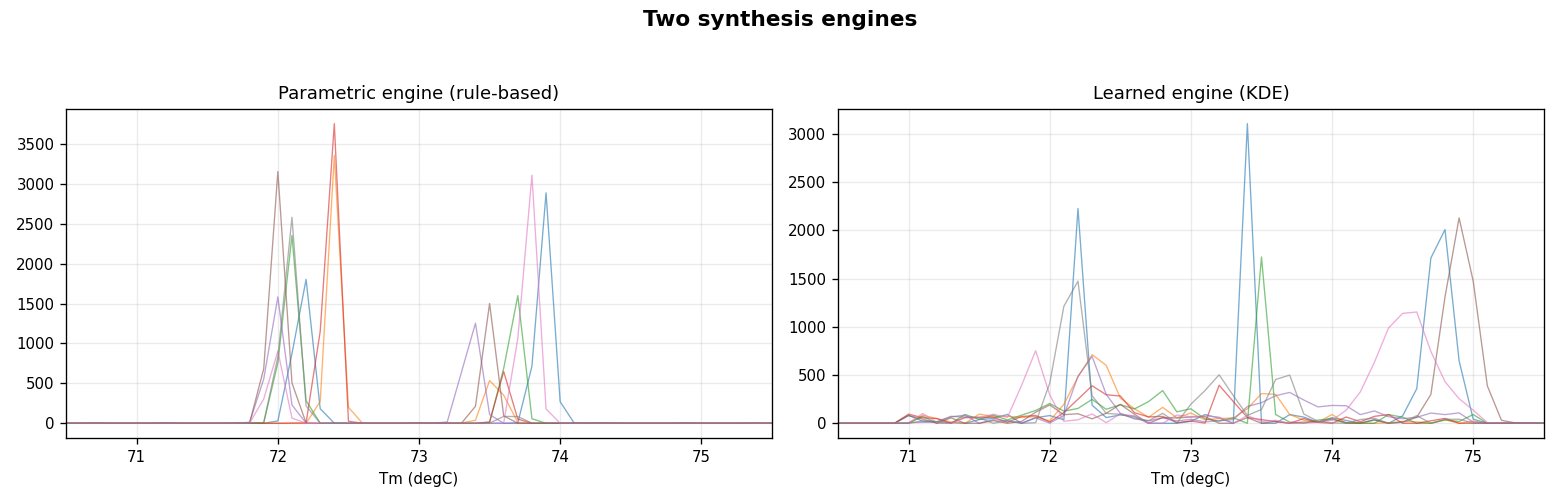
Two synthesis engines — parametric (rule-based) vs. learned (KDE)두 가지 합성 엔진 — 파라메트릭(규칙 기반) vs. 학습(KDE)
Synthetic fidelity vs. real data — JSD-validated Tm distributions합성 데이터 충실도 검증 — JSD로 검증한 Tm 분포
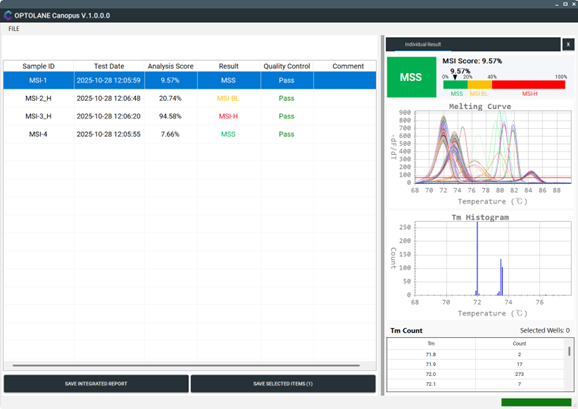
Dashboard — sample list, MSI scores & QC status (MSS example)대시보드 — 샘플 목록, MSI 점수, QC 상태 (MSS 예시)
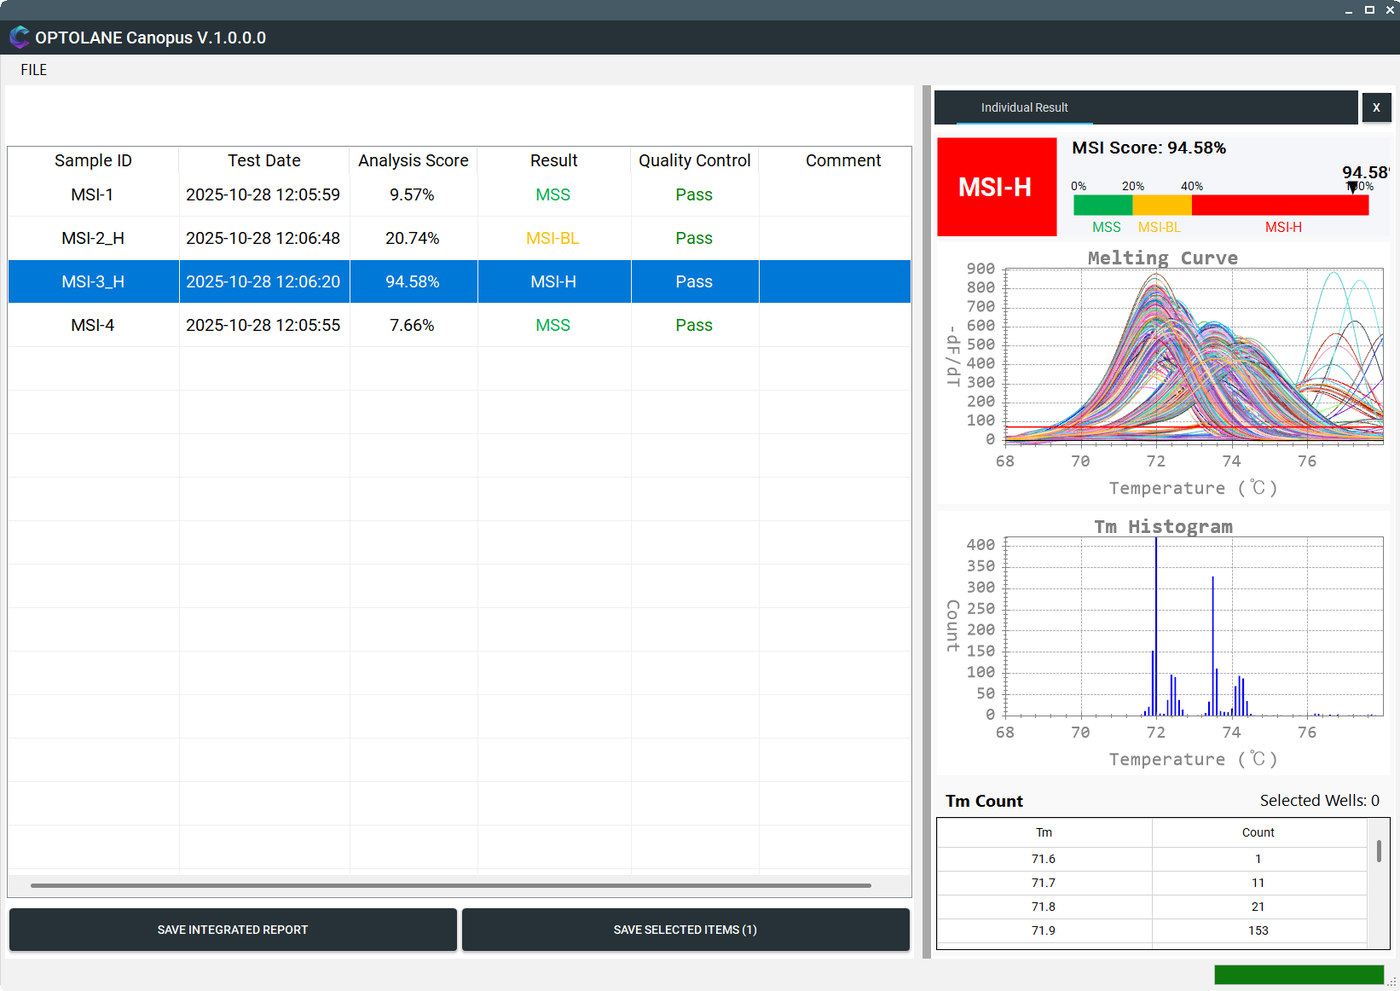
Individual result — MSI-H sample: melting curve, Tm histogram & MSI score개별 결과 — MSI-H 검체: 멜팅 커브, Tm 히스토그램, MSI 점수
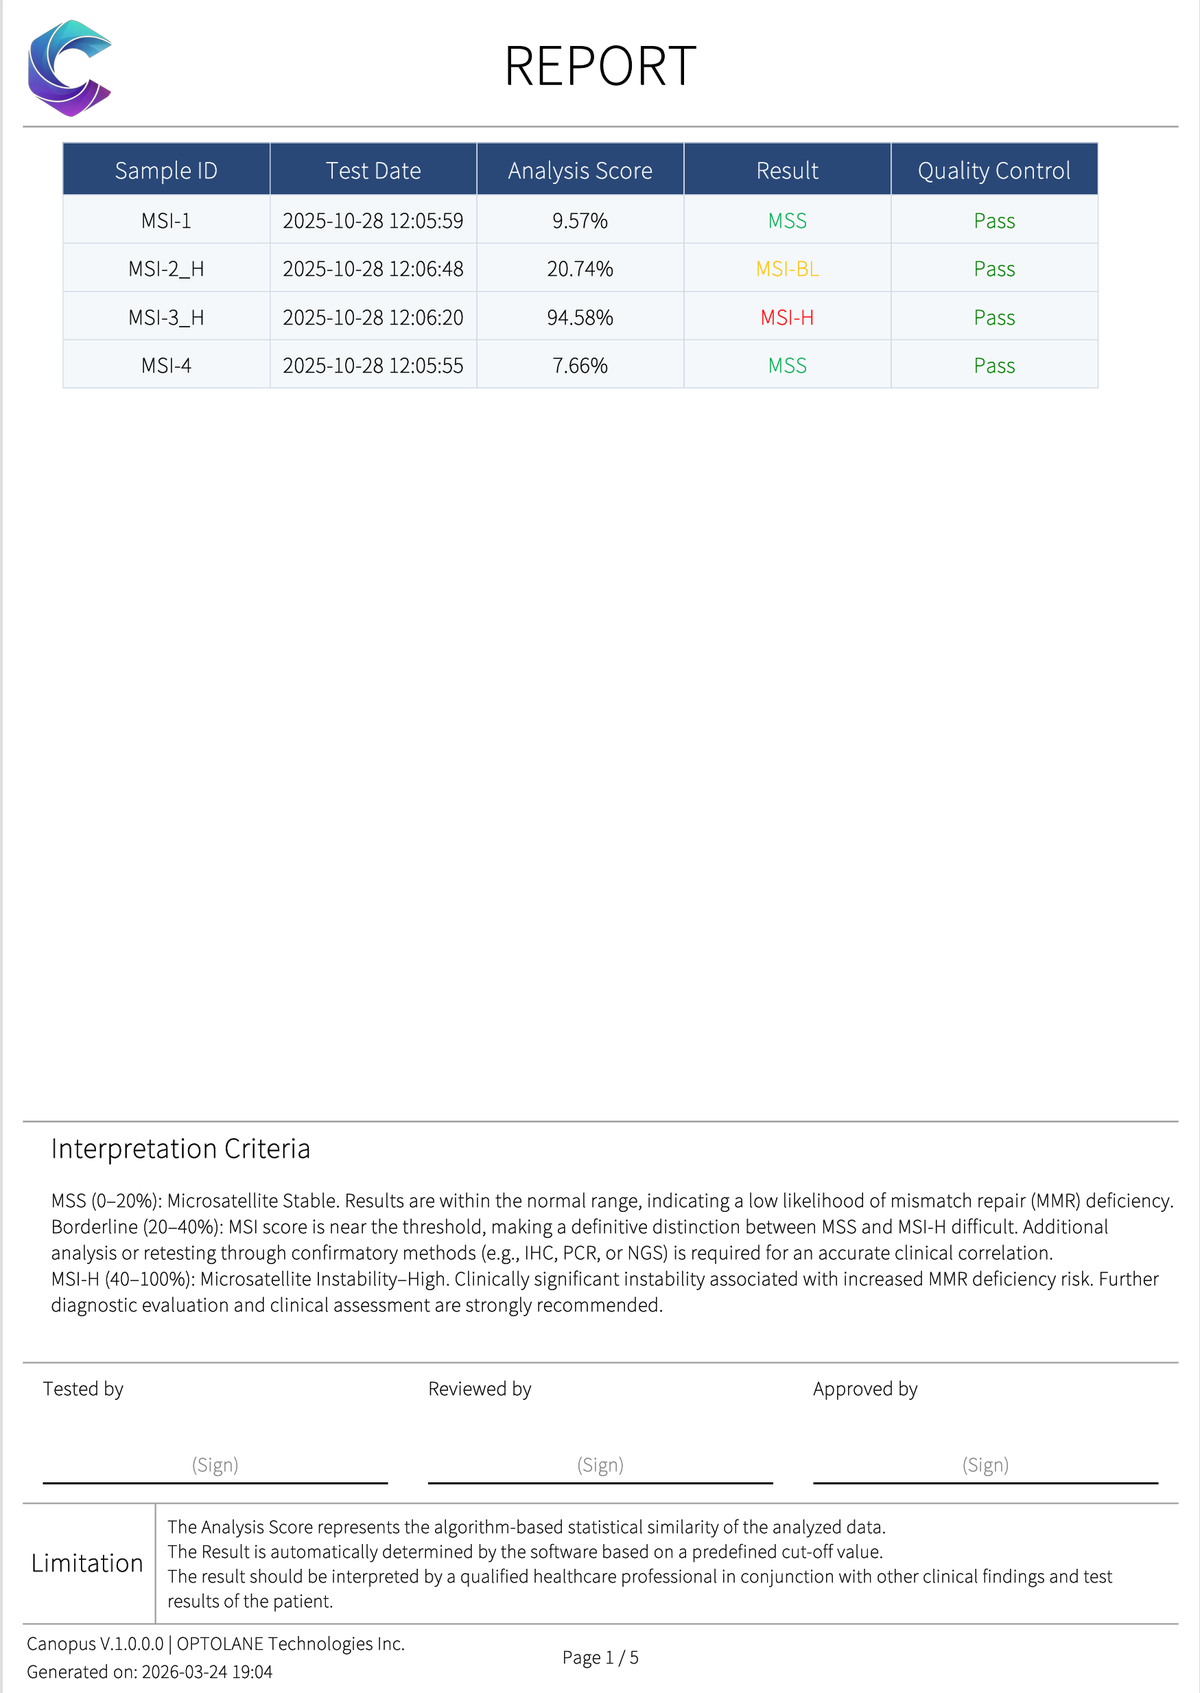
Clinical PDF report — one-click export: result table, interpretation criteria & sign-off임상 PDF 리포트 — 원클릭 내보내기: 결과 테이블, 판정 기준, 서명란
Drag & drop ODPI result files or a folderODPI 결과 파일·폴더 드래그 & 드롭
Tm histogram + AI scoring with QC pass/failTm 히스토그램 + AI 스코어링, QC 판정
MSI scores, thresholds & sample listMSI 점수·임계값·샘플 목록 확인
Melting curve & Tm histogram per sample검체별 멜팅 커브·Tm 히스토그램
Integrated or per-sample clinical report통합·개별 임상 리포트 출력
CGT AI Pipeline · Automating cell therapy quality analysis CGT AI 파이프라인 · 세포 치료제 품질 분석 자동화
Background배경
Cell Gene Therapy (CGT) uses viral vectors to deliver genetic material into individual cells. To assess whether this delivery worked — and at what potency — researchers need to know how many viral copies entered each cell. This is measured through Cell Number Variation (CNV) analysis: a metric that requires correlating each cell's count with its corresponding PCR signal in the same reaction zone. 세포 유전자 치료(CGT)는 바이러스 벡터를 이용해 개별 세포에 유전 물질을 전달합니다. 이 전달이 효과적으로 이루어졌는지, 그 효능이 어느 정도인지 평가하려면 각 세포에 바이러스 복제물이 몇 개나 침투했는지를 알아야 합니다. 이를 Cell Number Variation(CNV) 분석이라 하며, 각 반응 구역(well)의 세포 수와 동일 구역의 PCR 신호를 정밀하게 연동해야 측정됩니다.
Problem문제
Counting cells in each reaction well requires a researcher to manually inspect dozens of microscope images — a process that is slow, subject to operator bias, and impossible to scale for clinical throughput. Without accurate, automated cell counts, CNV analysis cannot reliably quantify viral transduction efficiency or assess cell therapy quality. 각 반응 구역의 세포를 계수하려면 연구자가 수십 장의 현미경 이미지를 수작업으로 검토해야 합니다. 이는 느리고 운영자에 따라 결과가 달라지며 임상 수준의 처리량에 대응할 수 없습니다. 정확하고 자동화된 세포 계수 없이는 바이러스 침투 효율 측정이나 세포 치료제 품질 평가에서 CNV 분석의 신뢰성을 확보하기 어렵습니다.
Solution해결책
An automated dual-track pipeline that simultaneously processes optical microscope images and digital real-time PCR measurements. The system maps each reaction zone precisely using a pre-designed well layout, separates individual well images, counts cells with a deep learning model, then integrates the results with PCR data — delivering per-well CNV values fully automatically. 광학 현미경 이미지와 디지털 실시간 PCR 측정값을 동시에 처리하는 자동화 이중 트랙 파이프라인입니다. 사전 설계된 웰 레이아웃을 기반으로 각 반응 구역의 위치를 정밀하게 매핑하고, 개별 웰 이미지를 분리한 뒤, 딥러닝 모델로 세포를 계수하고, 이를 PCR 데이터와 연동해 웰별 CNV 값을 완전 자동으로 도출합니다.
Why it matters임상적 중요성
- Viral transduction efficiency — quantifies exactly how many viral copies entered each individual cell, the key metric in cell therapy potency assessment바이러스 침투 효율 — 개별 세포에 침투한 바이러스 복제물 수를 정밀 정량화, 세포 치료제 효능 평가의 핵심 지표
- Cell therapy quality control — enables reliable, operator-independent evaluation of whether the gene delivery worked at the single-cell level세포 치료제 품질 관리 — 단일 세포 수준에서 유전자 전달 성공 여부를 운영자 편향 없이 신뢰성 있게 평가
- >99.5% cell recognition accuracy — deep learning replaces manual counting with objective, reproducible results at any scale>99.5% 세포 인식 정확도 — 딥러닝이 수작업 계수를 대체, 어떤 규모에서도 객관적이고 재현 가능한 결과 제공
- Full prototype delivered in 2 months — end-to-end system including UI and analysis functions2개월 내 완전한 프로토타입 납품 — UI 및 분석 기능을 포함한 엔드투엔드 시스템
Key decisions & tradeoffs핵심 의사결정 및 트레이드오프
- Why a dual-track microscopy + PCR pipeline was chosen over a single-modality approach:단일 모달리티 대신 현미경 + PCR 이중 트랙 파이프라인을 선택한 이유: Cell counts alone lack context (morphology, viability, doublets are indistinguishable). PCR signals alone cannot ground truth cell number. The dual-track design creates a self-validating system: if cells and PCR signals misalign, the system flags potential data quality issues. This cross-modal verification directly improves confidence in CNV metrics used for clinical potency assessment.세포 계수만으로는 문맥 부족 (형태학, 생존율, 이중 세포 구분 불가). PCR 신호만으로는 세포 수 검증 불가. 이중 트랙 설계는 자체 검증 시스템을 만듭니다: 세포와 PCR 신호가 정렬되지 않으면 데이터 품질 문제 플래그. 이 교차 모달 검증은 임상 효능 평가에 사용되는 CNV 지표 신뢰도를 직접 향상시킵니다.
- Tradeoff between labeling quality, model robustness, and two-month prototype timeline:라벨링 품질, 모델 견고성, 2개월 프로토타입 일정 간의 트레이드오프: With a 2-month constraint, invested heavily in automated data augmentation (rotation, elastic deformation) and semi-supervised learning to reduce manual labeling burden. Labeled 5K high-quality reference cells from diverse wells, then trained on 50K+ augmented samples. Result: >99.5% accuracy on test sets, but acknowledged edge cases requiring domain-specific preprocessing in production deployment.2개월 제약으로 자동화 데이터 증강(회전, 탄성 변형)과 반감독 학습에 집중하여 수작업 라벨링 부담 감소. 다양한 웰에서 5천 개의 고품질 참조 세포를 라벨하고 50K+ 증강 샘플로 학습. 결과: 테스트 세트에서 >99.5% 정확도, 하지만 프로덕션 배포에서 도메인별 전처리가 필요한 엣지 케이스 인정.
- Current implementation limitations in edge cases (cell overlap, noisy wells, domain shift):현재 구현의 한계 (세포 중첩, 노이즈 웰, 도메인 시프트): Overlapping cells (~5% of wells) are counted as single clusters—conservative for safety. Severely noisy wells (precipitation, bubbles) require manual inspection flag. Image domain shift (different microscope optics, staining batches) can degrade accuracy by 2–5%; mitigated by well-layout registration preprocessing. Future work includes attention-based instance segmentation and transfer-learned multi-microscope models.세포 중첩(웰의 ~5%)은 단일 클러스터로 계수—안전을 위해 보수적. 심하게 노이즈 있는 웰(침전, 기포)은 수작업 검사 플래그 필요. 이미지 도메인 시프트(다른 현미경 광학, 염색 배치)는 정확도를 2–5% 저하시킬 수 있음; 웰 레이아웃 등록 전처리로 완화. 향후 작업은 어텐션 기반 인스턴스 분할 및 전이 학습 다중 현미경 모델 포함.
How CNV Analysis Works — Three-Stage OverviewCNV 분석 작동 원리 — 3단계 개요
Well Localization웰 위치 파악

A pre-designed well grid map is used to precisely locate each reaction zone within the microscope image. Each well is then separated as an individual image for downstream analysis. 사전 설계된 웰 격자 맵으로 현미경 이미지 내 각 반응 구역의 위치를 정밀하게 파악합니다. 이후 각 웰을 개별 이미지로 분리하여 다음 단계에서 분석합니다.
AI Cell CountingAI 세포 계수
A deep learning model automatically identifies and counts every cell within each separated well image — replacing manual microscope counting with objective, reproducible results. 딥러닝 모델이 분리된 각 웰 이미지에서 모든 세포를 자동으로 감지하고 계수합니다. 수작업 현미경 계수를 객관적이고 재현 가능한 결과로 대체합니다.
CNV AnalysisCNV 분석
Cell count per well is matched with the PCR signal from the same well, revealing how many viral gene copies entered each cell. 웰별 세포 수를 동일 웰의 PCR 신호와 매칭하여 각 세포에 몇 개의 바이러스 유전자 복제물이 침투했는지 측정합니다.
| Well웰 | Cell Count세포 수 | CNV |
|---|---|---|
| #2 | 102 | 1.71 |
| #8 | 174 | 2.52 |
| #24 | 215 | 2.80 |
Automated Pipeline — How the two data sources are unified자동화 파이프라인 — 두 데이터 소스의 통합 과정
Using the well grid map, identify exactly where each reaction zone is in the microscope image and extract it as an individual image.웰 격자 맵으로 현미경 이미지 내 각 반응 구역의 위치를 특정하고 개별 이미지로 추출합니다.
Extract and process the PCR amplification signal from each individual reaction zone to quantify gene copy numbers.각 반응 구역의 PCR 증폭 신호를 추출하고 처리하여 유전자 복제 수를 정량화합니다.
A deep learning model detects and counts every cell within each separated well image — automatically and objectively.딥러닝 모델이 분리된 각 웰 이미지 내 모든 세포를 자동으로 감지하고 객관적으로 계수합니다.
Align PCR signal data with the spatially indexed well positions so every well's signal corresponds to the correct reaction zone.PCR 신호 데이터를 공간적으로 인덱싱된 웰 위치와 정렬하여 모든 웰의 신호가 올바른 반응 구역에 대응하도록 합니다.
Cell count per well is combined with the PCR signal from the same well to compute the CNV value — the number of viral gene copies per cell. This directly measures how effectively the viral vector delivered its genetic cargo into individual cells.웰별 세포 수와 동일 웰의 PCR 신호를 결합하여 CNV 값, 즉 세포당 바이러스 유전자 복제 수를 산출합니다. 이는 바이러스 벡터가 개별 세포에 유전적 화물을 얼마나 효과적으로 전달했는지를 직접 측정하는 지표입니다.
Open-source demo — public reference implementation of the CGT / CNV pipeline오픈소스 데모 — CGT / CNV 파이프라인의 공개 참조 구현

LOAA-M · Diagnostic PCR Platform — Qt UI, AWS integration & cybersecurity LOAA-M · 진단 PCR 플랫폼 — Qt UI, AWS 연동 & 사이버 보안
What it is제품 개요
LOAA-M is OPTOLANE's molecular diagnostic PCR instrument platform for clinical laboratories. The software stack drives real-time diagnostic data acquisition, analysis, cloud synchronization, and secure data management — operating in certified medical environments across Linux and Windows. LOAA-M은 임상 실험실을 위한 OPTOLANE의 분자 진단 PCR 기기 플랫폼입니다. 소프트웨어 스택은 실시간 진단 데이터 수집, 분석, 클라우드 동기화, 보안 데이터 관리를 담당하며 Linux 및 Windows 인증 의료 환경에서 운용됩니다.
My contributions담당 역할
Qt Desktop UIQt 데스크톱 UI
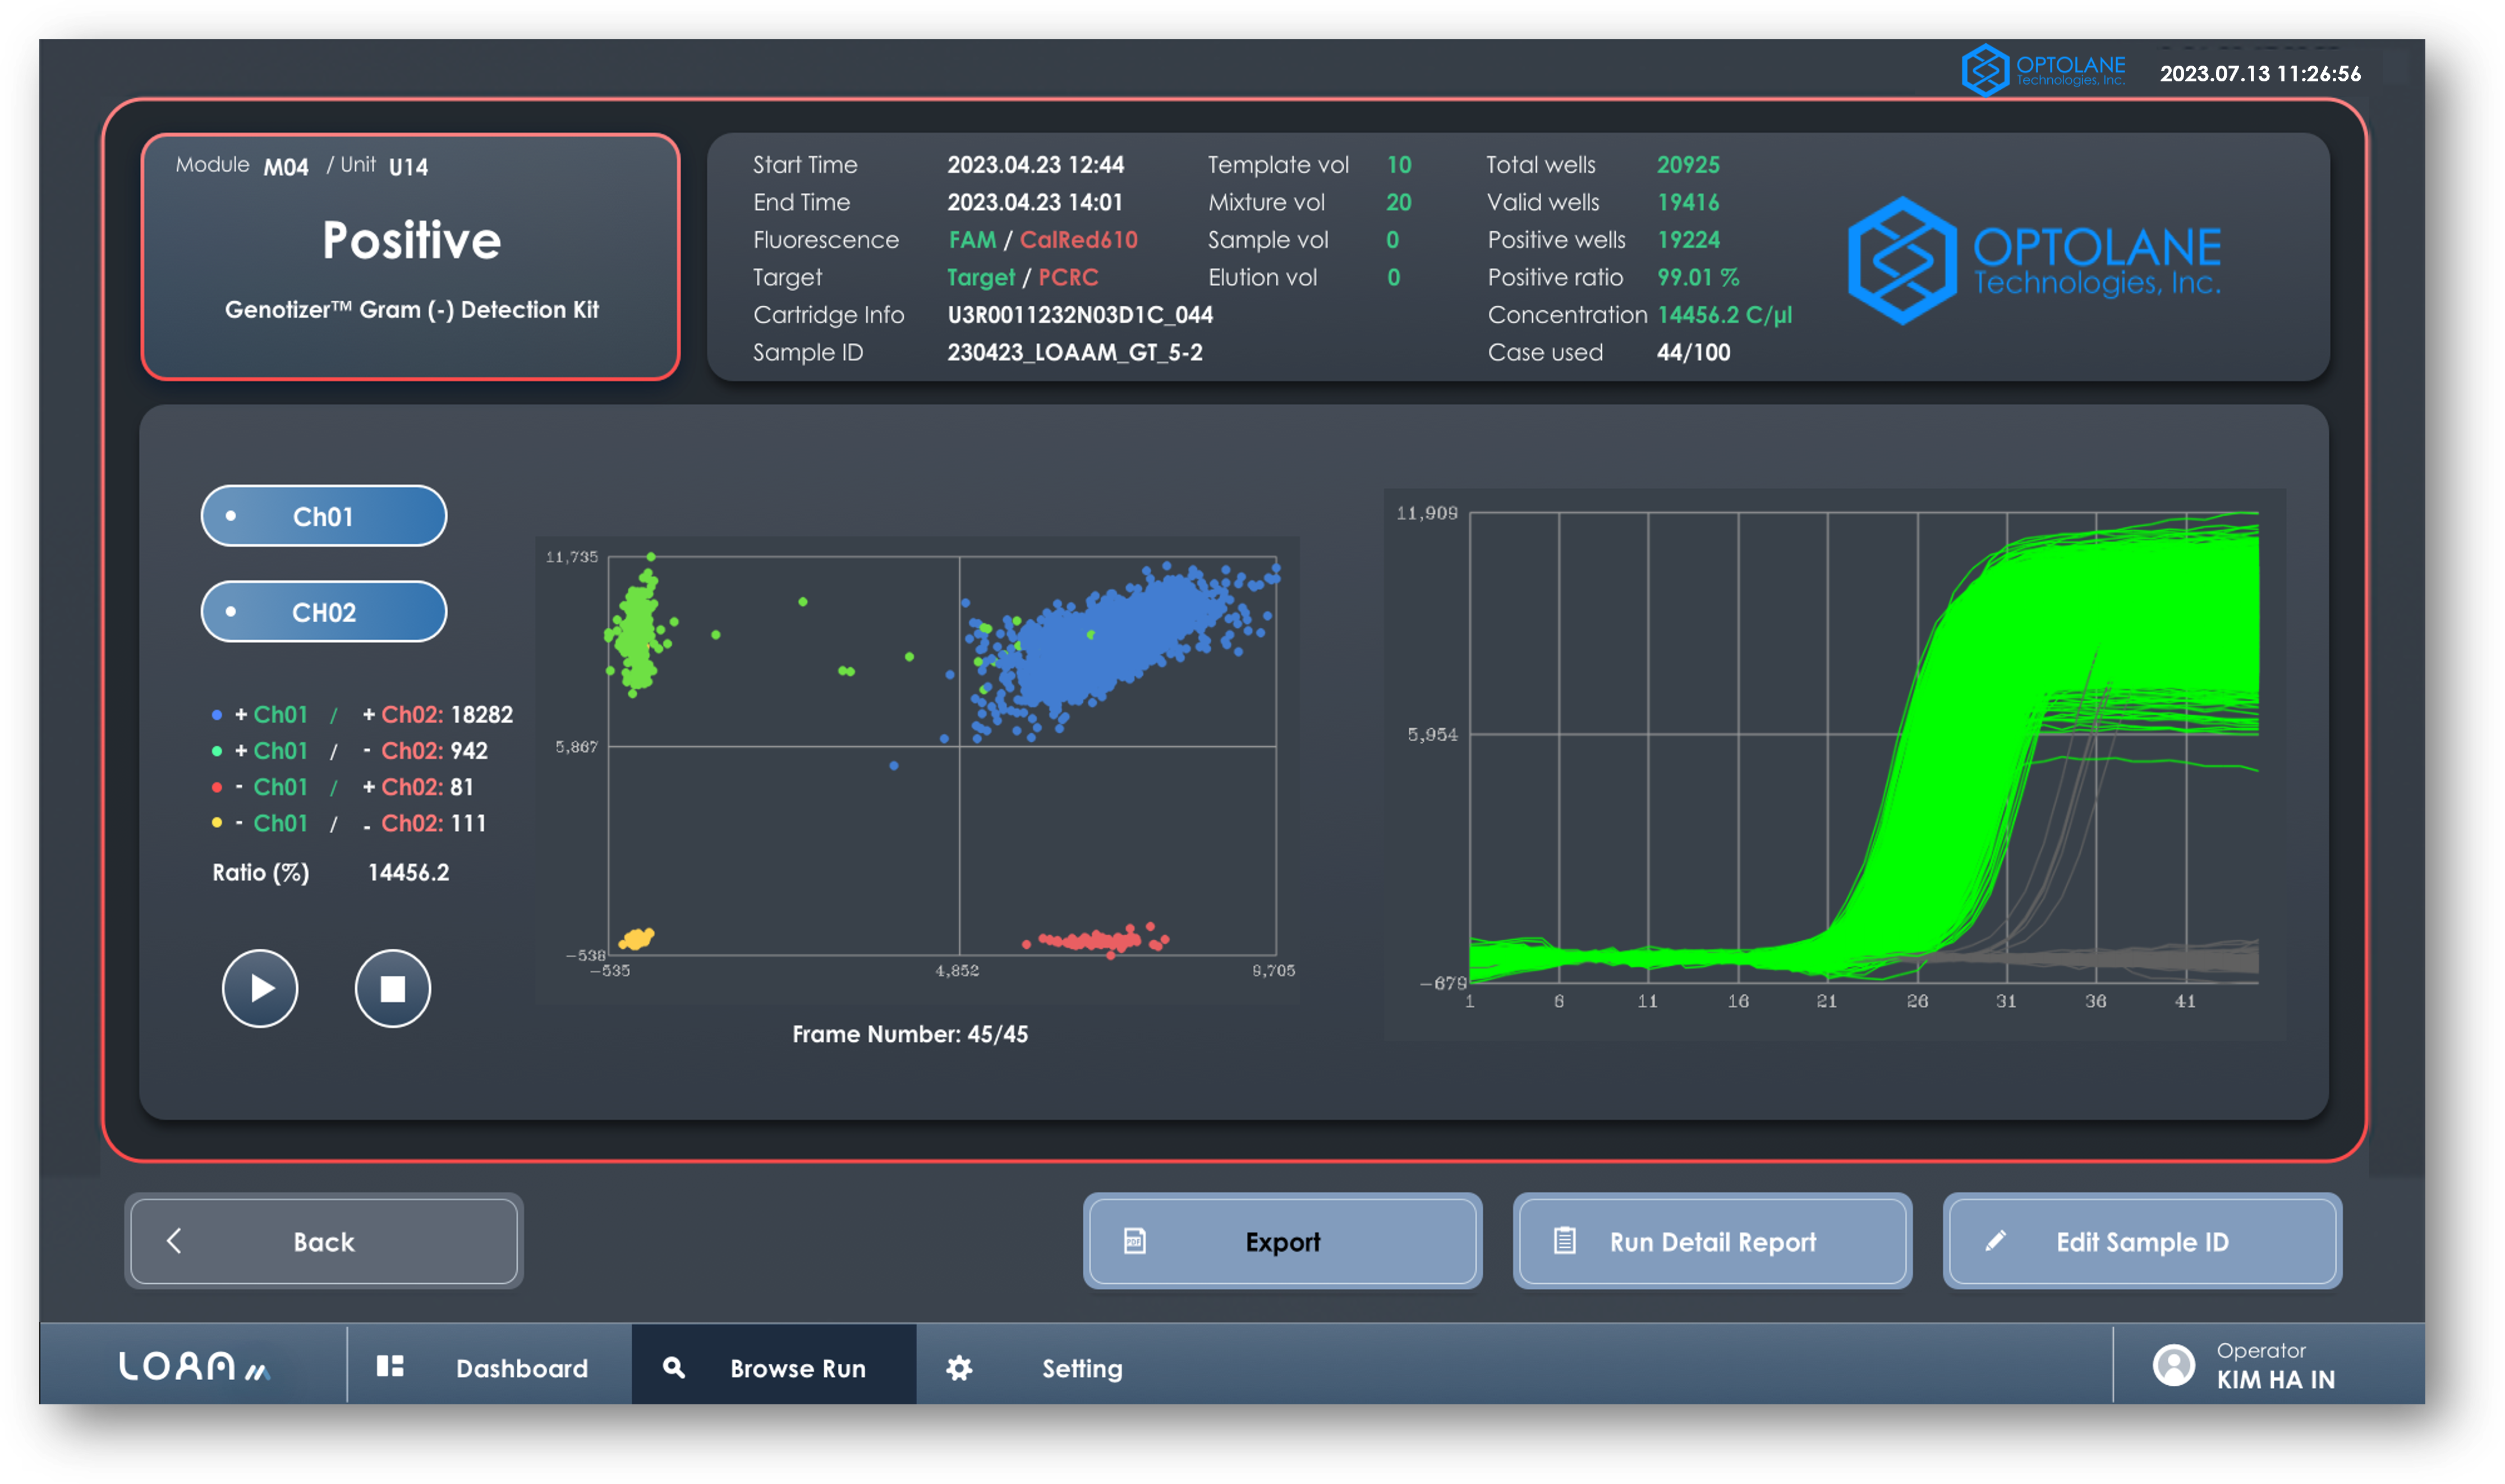
Led development of the full Qt-based operator UI for Linux and Windows. Designed real-time diagnostic data visualization, instrument control screens, and result review workflows optimized for clinical lab operators.Linux 및 Windows용 Qt 기반 운영자 UI 전체 개발을 주도했습니다. 실시간 진단 데이터 시각화, 기기 제어 화면, 임상 실험실 운영자에 최적화된 결과 검토 워크플로를 설계했습니다.
AWS Network IntegrationAWS 네트워크 연동
Built cloud data integration connecting LOAA-M instruments to AWS servers using Java on Windows. Implemented secure diagnostic data upload, retrieval, and multi-site synchronization across networked laboratory environments.Java를 사용하여 LOAA-M 기기와 AWS 서버를 연결하는 클라우드 데이터 연동을 구축했습니다. 보안 진단 데이터 업로드, 조회, 네트워크 연결 실험실 환경에서의 다중 사이트 동기화를 구현했습니다.
Cybersecurity Architecture사이버 보안 아키텍처
Designed and implemented the medical-grade security stack: equipment and network communication encryption, database access control with role-based permissions, and stored data encryption — fully compliant with CE-IVDR and MFDS cybersecurity requirements.의료 등급 보안 스택을 설계하고 구현했습니다: 기기·네트워크 통신 암호화, 역할 기반 권한의 데이터베이스 접근 제어, 저장 데이터 암호화 — CE-IVDR 및 MFDS 사이버 보안 요건을 완전히 충족합니다.
Impact & Achievement성과 & 달성
- Cross-platform Qt UI deployed on both Linux and Windows clinical environments with stable long-term operation크로스 플랫폼 Qt UI — Linux 및 Windows 임상 환경 모두에 배포, 안정적 장기 운용 중
- AWS cloud integration enabling multi-site diagnostic data sharing and remote result accessAWS 클라우드 연동 — 다중 사이트 진단 데이터 공유 및 원격 결과 접근 가능
- End-to-end encryption across device, network, and database layers meeting medical device security standards엔드투엔드 암호화 — 기기·네트워크·데이터베이스 레이어 전반에 걸쳐 의료기기 보안 기준 충족
- CE-IVDR and MFDS certification documentation prepared covering UI scenarios, security architecture, and data managementCE-IVDR 및 MFDS 인증 문서 작성 — UI 시나리오, 보안 아키텍처, 데이터 관리 망라
- MariaDB optimization for high-throughput diagnostic data storage with secure access controls and performance tuningMariaDB 최적화 — 고처리량 진단 데이터 저장, 보안 접근 제어, 성능 튜닝
Key decisions & tradeoffs핵심 의사결정 및 트레이드오프
- Why Qt + native desktop stack was prioritized over web-first alternatives for this device class:이 장비군에서 웹 우선 대안 대신 Qt + 네이티브 데스크톱 스택을 우선한 이유: Medical devices demand deterministic real-time responsiveness, direct hardware control, and offline-first operation. Qt native stack provides low-latency access to device drivers, eliminates browser runtime variability, and ensures consistent UI behavior across healthcare environments. Web stacks introduce unpredictable dependencies (network connectivity, browser updates) incompatible with certified clinical workflows.의료기기는 결정적 실시간 반응성, 직접 하드웨어 제어, 오프라인 우선 운영을 요구합니다. Qt 네이티브 스택은 장치 드라이버에 대한 저지연 접근, 브라우저 런타임 가변성 제거, 의료 환경 전반에서 일관된 UI 동작 보장을 제공합니다. 웹 스택은 인증된 임상 워크플로와 양립 불가능한 예측 불가능한 의존성(네트워크 연결성, 브라우저 업데이트)을 도입합니다.
- Tradeoff between stronger security controls and operator workflow simplicity in clinical settings:임상 환경에서 강화된 보안 제어와 운영자 워크플로 단순성 간의 트레이드오프: Implemented role-based access control (pathologist, technician, admin tiers) requiring multi-step authentication for sensitive operations. Balanced security through contextual UI: routine workflows remain streamlined, while result modification or system configuration demand explicit credential challenges. This preserves usability for high-volume throughput while preventing unauthorized result tampering.민감한 작업에 대한 다단계 인증이 필요한 역할 기반 접근 제어(병리학자, 기술자, 관리자 계층)를 구현했습니다. 문맥적 UI를 통해 보안 균형: 일상 워크플로는 간소화되어 있고, 결과 수정이나 시스템 설정은 명시적 자격증명 도전 요구. 이는 미의가 결과 조작 방지 또는 높은 처리량 사용성을 보유합니다.
- Regulatory and deployment constraints that shaped cloud/network architecture choices:클라우드/네트워크 아키텍처 선택에 영향을 준 규제 및 배포 제약: CE-IVDR and MFDS regulations prohibit real-time data export to non-certified third-party cloud services. Implemented private AWS VPC deployment with encrypted point-to-point communication and on-premise data retention policies. Multi-site synchronization uses encrypted offline channels, ensuring diagnostically sensitive PCR results never traverse uncontrolled networks. This architecture complies with data residency requirements while enabling laboratory result sharing within organizational firewalls.CE-IVDR 및 MFDS 규제는 인증되지 않은 제3자 클라우드 서비스로의 실시간 데이터 내보내기를 금지합니다. 암호화된 지점간 통신 및 온프레미스 데이터 보유 정책을 사용하는 프라이빗 AWS VPC 배포를 구현했습니다. 다중 사이트 동기화는 암호화된 오프라인 채널을 사용하여 진단상 민감한 PCR 결과가 제어되지 않는 네트워크를 통과하지 않도록 보장합니다. 이 아키텍처는 조직 방화벽 내에서 실험실 결과 공유를 가능하게 하면서 데이터 상주 요건을 준수합니다.
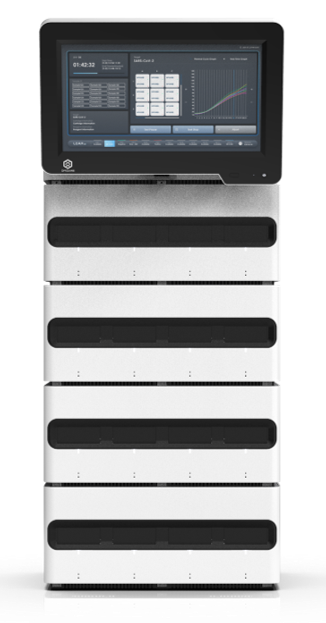
LOAA-M PCR Instrument — Clinical deploymentLOAA-M PCR 기기 — 임상 배포
Qt UI — Real-time diagnostic interfaceQt UI — 실시간 진단 인터페이스
Deep Learning Breast Cancer Targeting Model 딥러닝 기반 유방암 표적화 모델
Objective목표
Develop a deep learning model for breast cancer prediction, applying advanced targeting techniques to push accuracy beyond baseline EfficientNet-B2 performance.딥러닝 기반 유방암 예측 모델을 개발하고, 고급 표적화 기법을 적용하여 기준 EfficientNet-B2 성능 이상의 정확도를 달성했습니다.
Approach & Result접근법 & 결과
- Designed breast cancer prediction model based on EfficientNet-B2, achieving initial accuracy of 86%EfficientNet-B2 기반 유방암 예측 모델 설계, 초기 정확도 86% 달성
- Applied probability-density–based targeting enhancement techniques to improve model focus on high-risk regions확률 밀도 기반 표적화 향상 기법 적용으로 고위험 영역에 대한 모델 집중도 향상
- Improved accuracy to 93% — a 7 percentage-point gain through targeted enhancement표적화 향상을 통해 정확도를 93%로 개선 — 7%p 향상
Contact연락처
Interested in project details, collaboration, or role fit? Reach out via email or LinkedIn. 프로젝트 상세 내용, 협업, 역할 적합도 관련 문의는 이메일 또는 LinkedIn으로 연락 주세요.